
Faston
Commodity
& Business
Advisor AB
Insights and Articles
Share our thoughts
Hockey sticks Basics - Standard options
Introduction
Hockey sticks are useful to describe option payout in different scenarios. They visualize the return at different market out comes and with different options and thus useful when structuring deals or strategies. The hockey sticks do not show market-to-market value during the life span of the option. Just the possible outcomes at expiry. They do include the premium paid or received and thus sum the total possible outcome.
I will start walk you through how they work by using the example below and then move further to describe different options, synthetic options and typical option strategies.
The bought Call option
The horizontal line in the graph below shows the value of the underlying instrument. In this case a future. The on the left side it has a low market value and on the right side it has a higher market value. The further we move to the right the higher the value of the future.
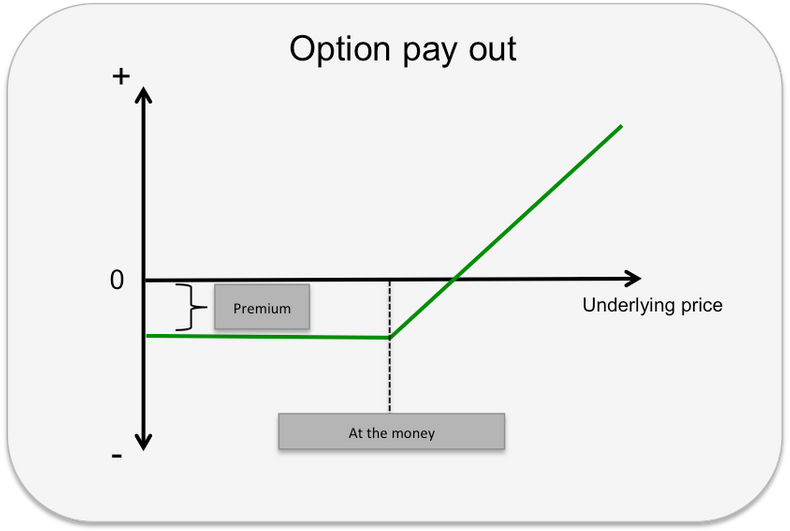
The vertical line describes the value of total payout of the option at expiry given the price of the future. The value is less on the downward side and higher on the upward price. So in short, option value on the vertical line and futures price on the horizontal line. Depending on were we are at the horizontal line in terms of price of the future we can plot a value for the options payout. In the example above we have plotted the pay out in green for a bought call option at different futures prices. As you can see the pay out graph resembles the shape of a hockey stick and hence the name.
The green curve starts at a negative value at the left indicating the size of the premium. The premium makes the total payout negative for an option that expires out of the money. As the market increases the option moves to at the money whereas the return from the option starts netting out the premium paid. When the market price for the underlying increases and passes the strike level, the option is in the money starts to pay out return. This is where the green line starts climbing, at the kink. In the graphs to follow, the strike levels are found at the kinks. (In strategies or structures there might be multiple kinks) As the option becomes more in the money the pay out increases even more. At the point were the green line crosses the horizontal line the return on the option is equal to the premium paid and thus the net pay out is zero and the option is at its break even point. If the futures price increases further the payout increases further.
The Sold Call option
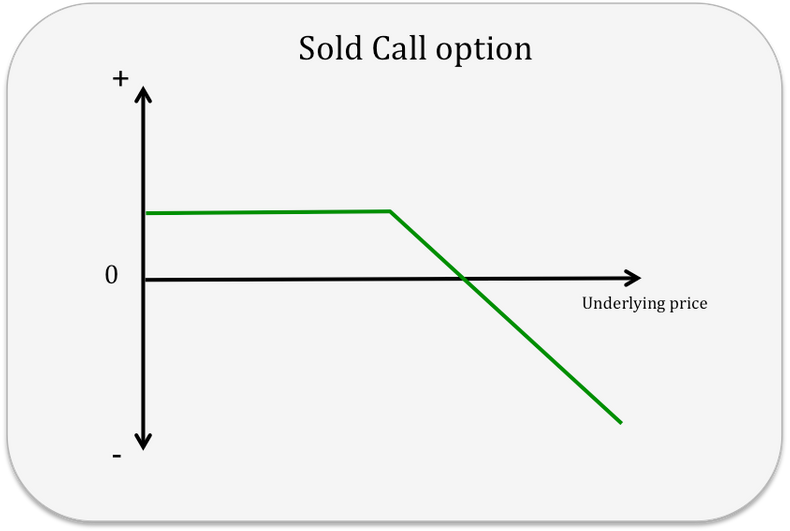
For the seller/writer of a call option the return pattern is opposite of the returns of the buyer of the option. The higher the value of the future, the greater the loss for the writer of the option. The green curve is at the money at the kink. For an un-hedged sold call option (naked call) the seller receives the full value of the premium if the futures price is lower that the strike level of the option. The higher the futures from that point the higher the losses. When the loss is equal to the premium the options is at its break even level. This is the green line cross the horizontal black line. As there is no limit to the futures price there is no limit to the loss of a written call. This may sound scary but most writers of options do hedge them selves and there are many techniques to reduce the risk of the ultimate doom. See my post about volatility trading for some techniques.
The bought Put option
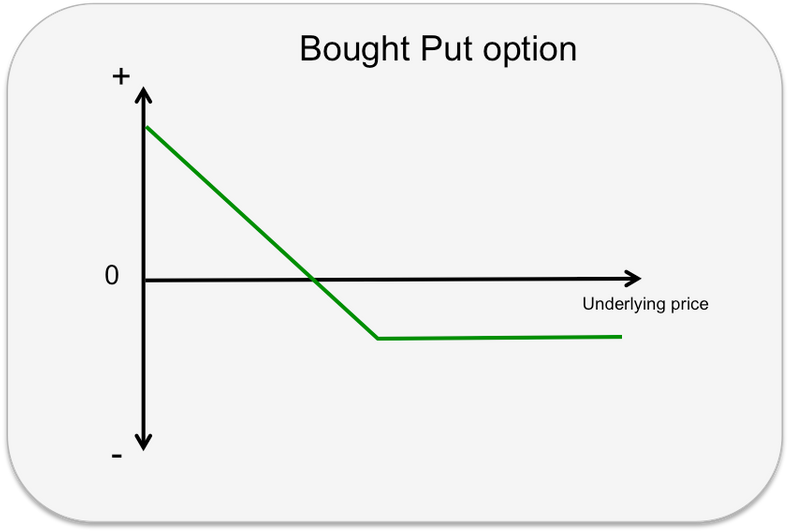
The buyer of a put option makes money when the price of the future falls. The lower the futures price (horizontal axis) the higher the value of the put (vertical axis)
The sold Put option
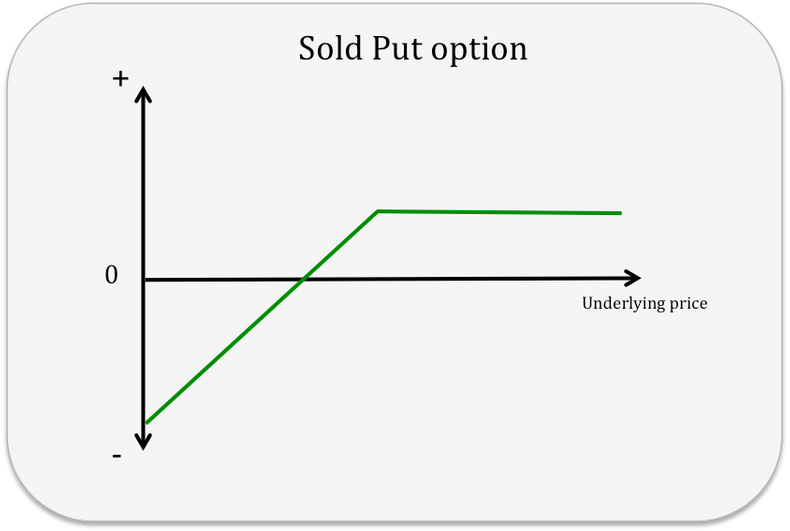
For the writer of a put option the loss increases when the price of the future fall and is the very opposite of the return for the buyer. Most of the time the futures price does not decrease below 0 and thus the loss of the put is limited. This is off course not the case in markets that allows for negative prices.
About Us
Contact
Insight
Home
CONNECT WITH US
Follow Us On Social Networks


Faston
Commodity
& business
advisor
Copyright © Faston 2016