
Faston
Commodity
& Business
Advisor AB
Insights and Articles
Share our thoughts
Option Greeks
To understand options and the price of options its essential to understand the option Greeks.
The Greeks are the terms used to describe the many factors affecting the price of the option, the options premium. The most important ones are delta, gamma, theta, vega and rho. They are named after Greek letters (however vega is not a Greek letter). The Greeks describes and quantify the sensitivity in the options premium due to changes in the components defining the options price, underlying price (price of the asset which the option is issued for), strike price (the price at which the option gives the buyer the right to sell or buy the underlying at), volatility, interest rate and time to expiry.
Delta
Delta is a measure of the premiums sensitivity to change in the price of the underlying asset. If the delta is 50%, the option premium on a call increases by 50% of the increase in the underlying asset, meaning that if the asset increases by 1 euro, the option premium increases by 50% of 1 euro, which equals 50 cent. This is partly true as it is only valid for infinitesimal changes. The change in option price is non linear. The delta measures the increase in value at the very point it is measured at and is as such a linear measurement. (Technically it is the first derivative of change in option prices in respect to change in price of the underlying). The value of the delta is dependent on price on the underlying asset and with respect to the strike level of the option. To explain this further, we need to introduce a few more definitions on options. An option which have a strike price higher than the market price of the underlying, a so called out of the money option (point A in the graph below), has a lower delta. A call option with a strike price lower than the current market price of the underlying, is called in the money option, has a higher delta (point B). As the market price increases the delta increases but with an increasing speed. The premium follows the blue curve in the graph below from point A to point B as the price of the underlying asset increases from point a to point b. The option moves from being out of the money at point A to become in the money at point B.
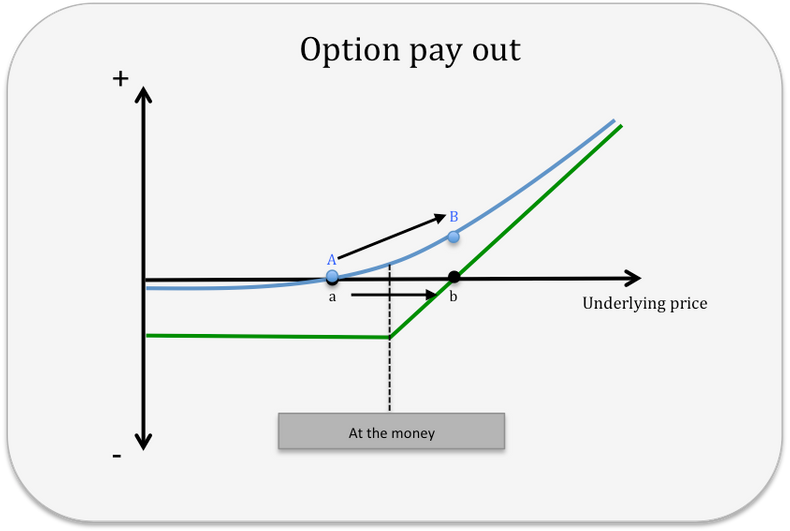
Graph 1: The blue curve describes how the option premium would develop if the price of the underlying increase or decreases along the black horizontal line. The Green curve describes the options value at expiry.
Traders use the delta is used to create a value neutral position in respect to changes in the underlying asset. When buying a call option with a delta of 50% for a 100 futures, a trader that wishes to have a price neutral position would sell 50 futures to offset the value gain in the options if the futures market increases.
As the futures increase in value with 1 euro the options increases by 50% of 1 euro, which is 50 cents. The gain would equal the value lost by have sold 50% of the volume in futures. However, as previously explained, this is not the case, as the increase in value of the options would accelerate and the value would be higher than what futures would loose. The same if the futures market falls the gain from the sold futures would exceed the value lost in options, as the options value would decrease at a slower and slower rate. The delta has its imperfections being a linear measurement and the deviation in value is measured by gamma, which is explained below.
Gamma
The change in option price is described by a curve given the options nonlinear properties. The delta measures the value change in a specific point as the tangent at that point. The tangent is a straight line describing the slope of the curve at exact that point. Depending on where we measure the price of the options on that curve, the delta will increase or decrease with a changing speed. Moving from being out of the money towards being at the money, the option value does not only increase but the increase accelerates. Passing the at the money point the option value will continue to increase but at a decreasing speed.
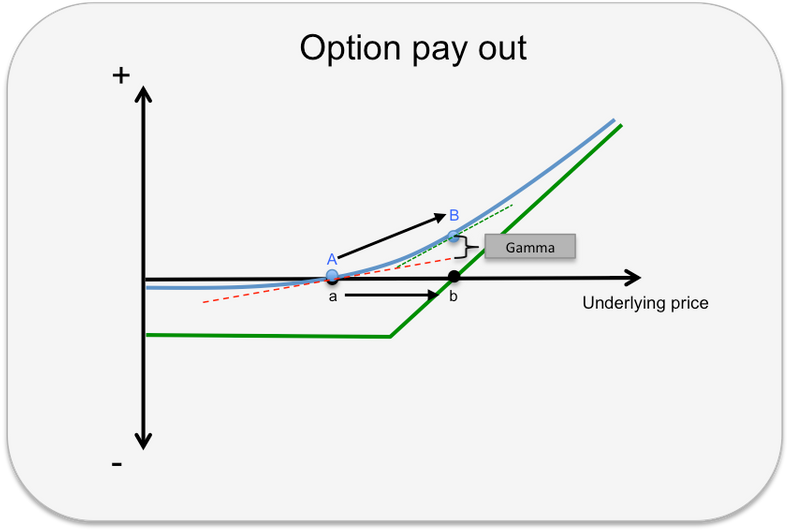
Graph 2: The red dotted sloped line shows the rate of change in option value at point A. At point B this is illustrated as the green dotted line. Both are showing the delta at each point. The change in slopes is the gamma.
The gamma measures the speed of change in delta. If we measure the delta at point A in the graph above, the price of the options is to follow the slope of the red dotted line (the tangent at point A) when the price of the underling moves up or down. Instead the value increases to point B. When measuring the delta at point B we can see that the value is to increase faster than at point A following a steeper slope, illustrated by the blue dotted line. The distance from the tangent derived from point A, the red dotted line, to B is the gamma. The deviation in value predicted by the delta at point A and the actual market value measured at point B.
Delta and gamma helps traders understand the sensitivity of the options value relative price changes in the underlying asset.
Vega
The price of an option is dependent on the volatility of the underlying. The more volatile the underlying asset, the higher the value of the option. Vega describes the sensitivity of the premium to volatility by indicating how much the premium increases by an increase in volatility and vice versa. The closer the option is to be at the money, the higher the price sensitivity to volatility. For an in the money or a far out of the money option, the sensitivity is less.
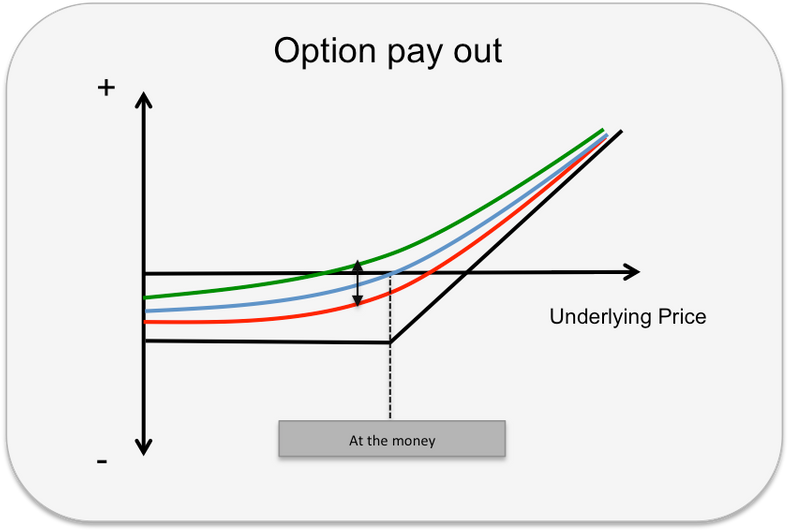
Graph 3: The Blue line shows the supposed value development of the option premium at different price levels of the underlying asset. The blue curve crosses the black line at the market price of the underlying which coincides with the options strike level. At this point the option is “At the money”. The mark to market value at this point is zero. The Green curve shows that at a higher volatility the premium has increased overall and the increase is at its greatest at the at the money point. The red curve shows the development of the premium when priced at lower volatility and the mark to market value for the “at the money” option has entered negative territory.
A trader that seeks high exposure to changes in volatility seeks to buy or sell at the money options to receive the greater impact. However with increased volatility the market moves and the options tend to become in or out of the money options with less exposure to vega.
Theta
Measures the sensitivity of the options premium relative to change in time. The option premium consists of two things, time value and real value, or extrinsic and intrinsic value. In simplified terms, the time value is given by the options chance to be in the money and by how much, the probable value of the options payout. There is an obvious connection to volatility as the higher the volatility and more time to maturity the option has a better possibility to reach a higher degree of “in the moneyness”. To further explain, theoretically an at the money option would have a 50% chance of being out of the money and 50% of being in the money at maturity. The value of being out of the money would be 50% times zero. The value of being in the money would be 50% of being of the other side of the strike price and thus in the money. The probability adds value to the option. How far in to the money depends on time and volatility. It is like speed and time. With a high speed (volatility) and a lot of time the price could move rather far into the probability distribution o price outcomes.
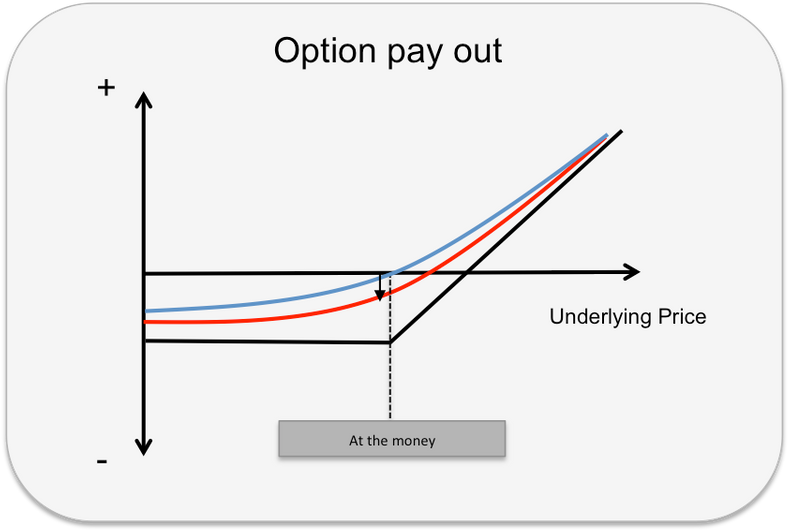
Graph 4: As time is passing by and the options lifespan decreases the premium falls. In a short perspective, the value decay is illustrated by the blue and red curves. The blue curves falls towards the red curve. Eventually the blue curve would fall to the black curve with no time value at all.
High volatility and long time to maturity thus gives higher time value. Low volatility and low time left to maturity gives less value. At any given volatility, shorter time gives lower time value and longer time to maturity gives higher time value. As time to expiry always decreases the options premium falls forced by gravity like an apple. Theta indicates the speed of value decay due to time loss. The value decreases towards zero eventually and decrease at a faster pace at the end of the time like a parable curve showed below

Graph 5: The red curve describes the value decay of an option as it comes closer to the maturity date. The possible outcome on higher returns diminishes as time decreases.
Rho
Rho indicates the premiums sensitivity to interest rate. By all Greeks discussed in this post this is the least significant but still worth explaining. The premium is paid upfront and has to be valued against all cash flows generated over the life span of the option and the underlying asset. To do so the option models in general discount cash flows to the same date or present value to make the cash flows comparable.
For commodity traders futures and forwards are the most common instruments to trade options on. Therefor we will assess the Rho from the viewpoint that cash flows from the underlying instrument are generated in the future. If interest rates increases the premium falls on call options. This is quite the opposite of call options on cash products whereas the premium on a call option increases when interest rate increases.
The fact that options on cash and options on futures are so different when it comes to sensitivity to interest rate demands further explanation. I will keep it at the simplest level starting with an at the money call option on cash (equity or storable commodity). The model would discount the strike price at that is the price the underlying would be bought at if the option were exercised. The alternative cost is lower for a future purchase at same price as if purchased today. By discounting the strike price the option becomes slightly more in the money and thus a higher premium. For a put option the option becomes slightly out of the money ant thus less worth. For an option on futures both the future price and the strike is discounted which decrease the overall value of the asset as such. We can compare two at the money options on two different assets, one at 50 and the other one at 100. The one with the strike and asset value at 100 have a premium double that of the option on the asset of 50. All other terms like time, volatility and interest rate equal.
About Us
Contact
Insight
Home
CONNECT WITH US
Follow Us On Social Networks


Faston
Commodity
& business
advisor
Copyright © Faston 2016